Here is a question most D2C founders cannot answer with confidence: which of your courier partners actually deserves your shipment volume?
Most brands pick couriers based on rate cards and gut feeling. A sales rep promises great coverage, the per-kg rate looks attractive, and the deal is done. Three months later, RTO is climbing, customers are complaining about delays, and nobody can say for sure which courier is causing the damage.
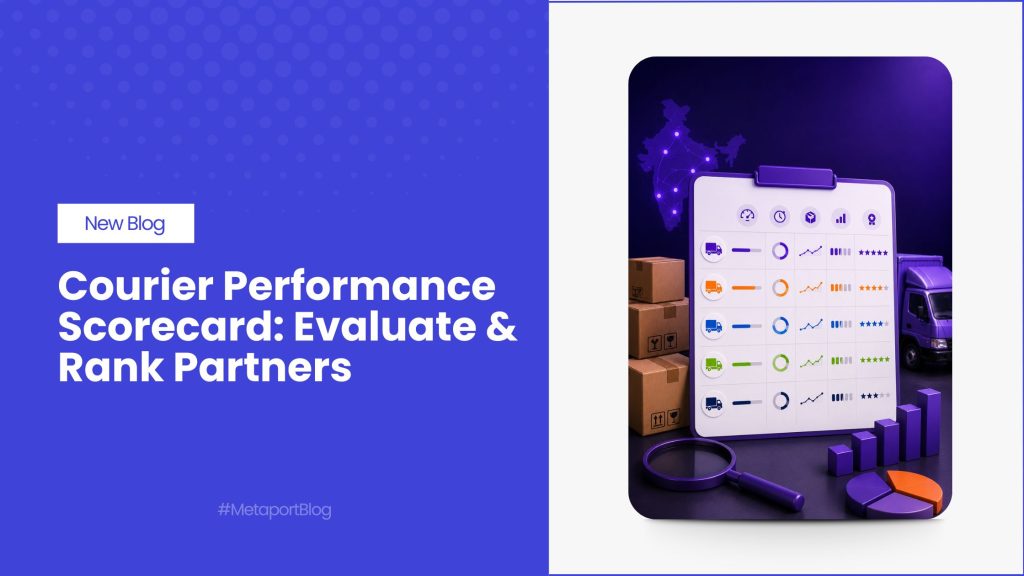
That is exactly the problem a courier performance scorecard solves. It replaces opinions with numbers. Instead of “Delhivery feels slower this month,” you get “Courier A’s on-time delivery rate dropped from 94% to 87% in the North zone, and their first attempt delivery rate is 9 points below Courier B.”
In this guide, we will cover what a courier performance scorecard is, the exact courier performance metrics to track, realistic benchmarks for Indian ecommerce, and a step-by-step weighted scoring model you can build in a spreadsheet this week. We will also look at how often to review scores and how to use them to shift volume between partners. Let’s get into it.
What Is a Courier Performance Scorecard?
A courier performance scorecard is a structured report card that measures each of your courier partners against a common set of KPIs, such as on-time delivery rate, first attempt delivery rate, RTO rate, and cost per shipment. Each metric gets a weight based on how much it matters to your business, and every courier receives a total score, usually out of 100.
Think of it like a school report card, but for your logistics partners. One subject alone does not decide the result. A courier might top the class in speed but fail in COD remittance discipline. The scorecard shows the full picture so you can rank partners fairly.
You may also hear the term carrier performance scorecard. It means the same thing. “Carrier” is more common in the US and Europe, while Indian ecommerce teams usually say “courier partner.” Either way, the goal is identical: turn scattered shipping data into a single, comparable score for every partner you work with.
Why Does This Matter So Much for Indian D2C Brands?
Shipping is not a small line item. Research from McKinsey & Company shows logistics costs typically eat 10 to 15% of total sales for retail and consumer goods companies, and last-mile delivery alone can account for over half of total shipping costs.
Now add the realities of the Indian market: heavy COD dependence, RTO rates that can hit 20 to 40% in fashion categories, wide variation in pincode serviceability, and weight discrepancy disputes that quietly inflate invoices. In this environment, an underperforming courier does not just annoy customers. It directly burns margin.
A scorecard gives you three things:
- Accountability. Couriers behave differently when they know you are measuring them. Quarterly reviews backed by data change conversations with account managers completely.
- Better allocation decisions. When you know Courier A wins in the South but struggles in the Northeast, you can route orders by lane instead of splitting volume blindly. This is the foundation of smart courier allocation.
- Negotiating power. Hard data on billing accuracy, weight disputes, and SLA breaches is your strongest card at the annual rate negotiation table.
Courier Performance Metrics: The KPIs Your Scorecard Needs
So what goes into the scorecard? Below are the courier KPIs for ecommerce that matter most, grouped into four buckets: delivery performance, returns and failures, cost and billing, and customer experience.
You do not need all of them on day one. Start with six to eight, then expand.
1. Delivery Performance Metrics
On-Time Delivery Rate (OTD)
The percentage of shipments delivered within the promised timeline.
Formula: (On-time deliveries ÷ Total deliveries) × 100
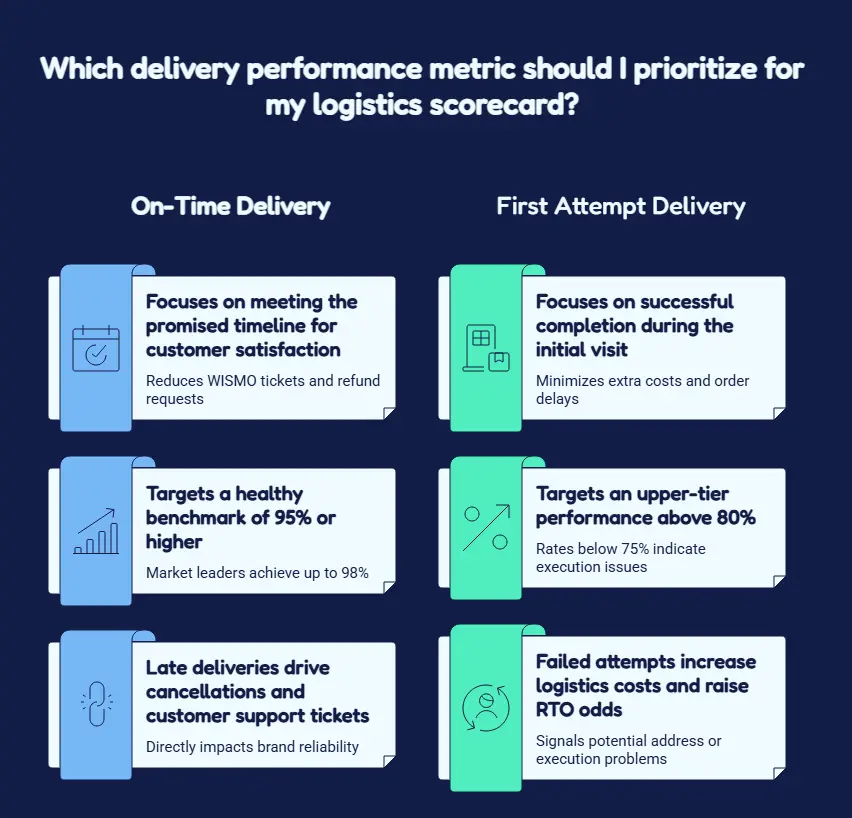
This is the single most-watched delivery performance KPI, and for good reason. Late deliveries drive WISMO tickets, cancellations, and refund requests. A healthy on-time delivery rate benchmark is 95% or higher, with market leaders pushing 98%, according to SmartRoutes.
First Attempt Delivery Rate (FADR)
The percentage of orders delivered successfully on the very first attempt. Every failed attempt adds cost, delays the order, and raises the odds of an RTO. If your first attempt delivery rate stays above 80%, you are in the upper tier of performance. Below 75%, dig into the causes: bad addresses, fake delivery attempts, or weak last-mile execution in specific zones.
Delivery Success Rate
Of all shipments handed to the courier, how many were ultimately delivered (as opposed to returned)? A good courier should stay above 85%, and top performers reach 90 to 95%, especially on prepaid orders.
Average Delivery Time (TAT)
The average number of days from pickup to delivery, measured by lane (metro to metro, metro to Tier 2/3, and so on). Averages across all of India hide problems, so always segment. A courier that delivers in 2 days to Bangalore but 9 days to Guwahati needs lane-level visibility.
OTIF (On-Time, In-Full)
Borrowed from B2B logistics, OTIF checks whether the shipment arrived on time and complete or undamaged. Useful if you ship multi-box orders or fragile products.
2. Returns and Failure Metrics
RTO Rate
The percentage of shipments returned to origin without delivery. RTO is the profit killer of Indian ecommerce. Each RTO means double freight, blocked inventory, repackaging cost, and often a lost customer.
What is a good RTO rate? Under 10% is workable, under 5% is excellent. COD-heavy fashion brands routinely see 20 to 40%, which is why RTO deserves one of the heaviest weights on your scorecard. If you are new to this metric, our explainer on NDR and RTO in ecommerce covers the basics.
NDR Rate and Resolution Speed
How many shipments raise a non-delivery report, and how fast does the courier act on your reattempt instructions? Two couriers can have the same NDR rate but wildly different resolution behavior. The one that reattempts within 24 hours of your instruction saves orders. The one that sits on NDRs for three days converts them into RTOs. An automated NDR management system makes this metric easy to track courier-wise.
Fake Delivery Attempt Rate
A uniquely painful problem in Indian last-mile logistics. The rider marks “customer not available” without ever visiting. Track the percentage of NDRs your customers dispute. If one courier’s disputed-NDR rate is double the others, that is a red flag worth escalating. We wrote a full playbook on handling fake delivery attempts.
Reverse Pickup Success Rate
If you offer returns, measure how reliably each courier completes reverse pickups on the first or second attempt. Slow reverse logistics delays refunds and wrecks the post-purchase experience.
3. Cost and Billing Metrics
Cost Per Shipment
Total freight billed divided by shipments delivered, tracked by weight slab and zone. Do not compare rate cards; compare effective cost, which includes surcharges, COD fees, and RTO freight. Our breakdown of hidden shipping surcharges explains why invoice cost rarely matches the rate card.
Weight Discrepancy Rate
The percentage of shipments where the courier billed a higher weight than you declared. Some couriers dispute 2% of shipments; others dispute 15%. Over a year, that gap is worth lakhs. Track disputes raised, disputes won, and average resolution time. (Here is our guide to fighting courier weight discrepancy disputes.)
Billing Accuracy
Beyond weight, check invoice-level accuracy: wrong zone charges, duplicate AWB billing, incorrect COD fees, RTO charged at forward rates. A courier with 98% billing accuracy saves your finance team days of reconciliation work every month.
COD Remittance Cycle
How quickly does the courier remit collected cash? T+2 is strong, T+7 is common, anything slower strains working capital. Also track remittance accuracy: does the amount remitted match the amount collected, every cycle?
4. Customer Experience Metrics
Delivery-Related Complaint Rate
Support tickets tagged to delivery issues (delay, rude rider, damaged box) divided by shipments, per courier. This connects courier behavior to the post-purchase customer experience your brand ultimately owns. Proactive CX engagement tools can soften the blow of a delay, but they cannot fix a chronically weak courier.
Claim Ratio / Damage Rate
Lost and damaged shipments as a percentage of total volume, plus how smoothly claims get settled. A low claim ratio signals good handling discipline in the courier’s network.
Tracking Quality
Are scan events timely and accurate? Ghost scans, missing milestones, and delayed status updates all inflate WISMO tickets, no matter how good your branded tracking page is.
Customer Satisfaction / NPS by Courier
If you run post-delivery surveys, segment NPS or CSAT by courier partner. It is often eye-opening. The same brand, the same product, and a 20-point NPS gap between two couriers serving different zones.
Benchmarks: What Good Looks Like
Use these industry benchmarks as starting targets, then tighten them based on your own category and data:
| Metric | Good | Excellent |
|---|---|---|
| On-time delivery rate (OTD) | ≥95% | 98%+ |
| First attempt delivery rate (FADR) | >80% | 88%+ |
| Delivery success rate | >85% | 90–95% |
| RTO rate | <10% | <5% |
| Weight discrepancy rate | <5% of shipments | <2% |
| COD remittance | T+7 | T+2 |
| Billing accuracy | >95% | >98% |
| Reverse pickup success (first attempt) | >75% | >85% |
One caveat: benchmarks shift by category, order profile, and payment mix. A COD-heavy fashion brand shipping to Tier 3 India should not judge itself against a prepaid electronics brand shipping metro-to-metro. Benchmark against your own history first, industry averages second.
How to Build a Courier Performance Scorecard: Step by Step
Now the practical part. Here is how to evaluate courier partners with a weighted scoring model you can build in Excel or Google Sheets in an afternoon.
- Step 1: Pick 6 to 10 Metrics That Match Your Pain
Do not track everything. If RTO is bleeding you dry, weight it heavily. If cash flow is tight, COD remittance matters more. A typical D2C starting set looks like this: OTD, FADR, delivery success rate, RTO rate, NDR resolution speed, weight discrepancy rate, cost per shipment, and COD remittance cycle.
- Step 2: Assign Weights That Add Up to 100
This is where your business priorities show up. An example weighting for a COD-heavy brand:
– Delivery success rate: 20
– RTO rate: 20
– On-time delivery rate: 15
– First attempt delivery rate: 10
– NDR resolution speed: 10
– Cost per shipment: 10
– Weight discrepancy rate: 8
– COD remittance cycle: 7
A prepaid-heavy brand might drop RTO to 10 and push OTD and tracking quality up instead. There is no universal answer. The weights are the strategy. - Step 3: Define a Scoring Scale for Each Metric
Convert raw numbers into scores of 1 to 5 (or 0 to 10). For example, for OTD:
– 5 points: ≥97%
– 4 points: 95–96.9%
– 3 points: 92–94.9%
– 2 points: 88–91.9%
– 1 point: <88%
Do this for every metric so a human cannot fudge the results. The scale is set once; the data does the talking every review cycle. - Step 4: Pull Data From One Source of Truth
This step decides whether your scorecard survives past month two. Pulling AWB-level data from five courier dashboards, matching it to your OMS, and reconciling invoices by hand takes days. Most teams quit here.
The fix is centralizing shipping data on one platform. A multi-carrier shipping platform that already captures every scan event, NDR, weight dispute, and invoice line item can generate courier-wise performance data automatically through a shipping analytics dashboard, which turns scorecard creation from a monthly project into a report you simply open. If your data lives across Shopify, your WMS, and courier panels, check which integrations your platform supports before you start. - Step 5: Score, Rank, and Segment by Lane
Multiply each metric score by its weight, sum it up, and you get a total out of 100 for every courier. Rank them. Then, and this is the part most brands skip, repeat the exercise by zone or lane. National averages hide the truth. Courier A might score 82 overall but 61 in the East. Carrier lane performance is where allocation decisions actually live.
- Step 6: Act on the Scores
A scorecard nobody acts on is decoration. Three actions to wire in:
1) Shift volume. Move share of shipments toward high scorers, lane by lane. If you use rule-based or AI-driven courier allocation, feed scorecard outcomes into your smart dispatch and allocation logic.
2) Run quarterly business reviews. Share the scorecard with each courier’s account manager. Set improvement targets with deadlines.
3) Trigger exits. Decide in advance what score, sustained for how long, gets a courier offboarded. Written rules prevent relationship-driven inertia.
How Do You Calculate On-Time Delivery Rate?
Since this is the most common question teams ask, let’s make it concrete.
OTD (%) = (Shipments delivered on or before promised date ÷ Total shipments delivered) × 100
Say a courier delivered 4,800 of your shipments last month and 4,505 arrived within the promised TAT. That is 4,505 ÷ 4,800 × 100 = 93.9%. Against a 95% benchmark, this courier is underperforming, and the gap of roughly 295 late orders represents real WISMO tickets and real refund risk.
Two details matter. First, measure against the customer-facing promise, not the courier’s internal SLA. If your checkout showed “delivery by June 12” via an EDD delivery predictor, that is the date that counts. Second, exclude shipments delayed by your own warehouse. Late dispatch is your problem, not the courier’s, which is why dispatch workflow automation belongs in the same conversation.
How Often Should You Review Courier Performance?
A three-tier cadence works well for most D2C brands:
- Weekly: A light pulse check on OTD, delivery success, and NDR aging. Catch a collapsing lane before it costs you a full month.
- Monthly: Full scorecard refresh. Update every metric, recalculate scores, and adjust volume allocation where gaps exceed your threshold (a move of 5 points or more on any metric deserves a conversation).
- Quarterly: Formal business reviews with each courier partner, plus a re-check of your weights. Business priorities shift; your scorecard should too.
During festive season, tighten the loop further. Courier networks behave differently under peak load, and a partner who scores 90 in July can crumble in October. Our festive season shipping playbook covers how to prepare capacity before the surge.
Which Courier Company Is Best for Ecommerce in India?
Honest answer: there is no single best, and anyone who names one without asking about your zones, weight profile, and payment mix is guessing.
The popular names, Delhivery, Blue Dart, XpressBees, Ecom Express, DTDC, Ekart, and Amazon Shipping, each have real strengths. Industry comparisons generally credit Delhivery with the widest pincode reach (17,500+ pincodes), Blue Dart with premium speed and reliability in metros, and XpressBees with strong COD handling and 90%+ on-time performance, per NimbusPost’s comparison.
But here is the thing: aggregate reputation tells you little about your lanes. A courier’s national delivery success rate is irrelevant if they underperform in the three states where 60% of your orders go. This is exactly why brands moving toward a BYOC (bring your own courier) model lean on their own scorecards instead of aggregator ratings: your data beats everyone else’s averages. (If you hold direct courier contracts, Metaport’s BYOC solution lets you manage them all from one panel.)
So flip the question. Instead of “which courier is best in India,” ask “which courier is best for my pincode mix, my weight slabs, and my payment split?” A courier performance scorecard answers that question every single month.
Shipping Aggregator vs Own Courier Contracts: Does the Scorecard Change?
A quick word on this, because it comes up in almost every conversation. If you ship through an aggregator, you still need a scorecard. The aggregator gives you access to many couriers, but it does not automatically route your orders to the best one for each lane, and its recommended courier rankings are built on averages across thousands of sellers, not on your data.
If you have moved to direct courier contracts, the scorecard becomes even more important. You now own the relationships, the SLAs, and the negotiations. Without performance data, you are negotiating blind.
In both models, the metrics stay the same. What changes is what you can do with them. Direct contract holders can renegotiate rates, restructure SLAs, and drop underperformers. Aggregator users can at least reallocate volume within the available courier pool and escalate chronic issues with evidence. Either way, measurement comes first.
From Scorecard to Courier Allocation: Closing the Loop
The real payoff of courier performance tracking is not the ranking itself. It is what the ranking feeds.
Manual allocation, where ops staff pick couriers shipment by shipment or via a static priority list, cannot keep up with lane-level performance shifts. A multi-courier strategy only pays off when allocation logic actually uses performance data: route prepaid express orders to the OTD leader, route COD orders in high-RTO pincodes to the courier with the best first attempt delivery rate there, and cap volume to any partner whose score is trending down.
Platforms like Metaport automate this loop end to end. Every shipment generates performance data, the data updates courier scores, and the allocation engine routes the next shipment based on those scores, factoring in serviceability, cost, and past performance for that exact pincode. The scorecard stops being a monthly spreadsheet and becomes a living system that gets smarter with every order. You can see how this compares to traditional setups in our logistics aggregator vs SaaS platform guide.
Free Courier Scorecard Template: How to Structure It in Excel
Want to build your carrier scorecard template in Excel or Google Sheets today? Here is the exact structure that works:
Sheet 1 – Raw Data. One row per courier per month per zone. Columns: courier name, zone, shipments handed over, delivered, delivered on time, delivered first attempt, RTOs, NDRs raised, NDRs resolved within 24 hours, weight disputes raised, disputes won, total freight billed, COD collected, COD remitted, remittance days.
Sheet 2 – Metric Calculations. Formulas that convert raw data into rates: OTD %, FADR %, delivery success %, RTO %, weight discrepancy %, effective cost per shipment. Keep every formula visible so anyone on the team can audit the numbers.
Sheet 3 – Scorecard. Rows for each metric with its weight, scoring scale, each courier’s raw value, its 1-to-5 score, and the weighted result. A SUMPRODUCT formula at the bottom gives each courier a total out of 100. Add conditional formatting: green above 85, amber 70 to 85, red below 70.
Sheet 4 – Lane View. The same scoring repeated per zone. This is the sheet your allocation decisions come from.
Three practical tips. First, lock the scoring scales so nobody adjusts them mid-quarter to make a favorite courier look better. Second, add a trend column showing each courier’s score change versus last month; a partner sliding 5+ points two months in a row needs a conversation even if their absolute score still looks fine. Third, timestamp your data pulls so QBR discussions reference the same numbers everyone agreed on.
The spreadsheet version works well up to a few thousand orders a month. Beyond that, manual data pulls become the bottleneck, and an automated dashboard that tracks these D2C shipping metrics in real time pays for itself quickly.
Common Scorecard Mistakes to Avoid
Before you build yours, sidestep the five mistakes we see most often:
- Judging on rate card alone. The cheapest courier on paper is frequently the most expensive after RTO freight, weight disputes, and lost-customer costs.
- Using national averages. Always segment by zone and lane. Averages are where insights go to die.
- Ignoring your own contribution. Late warehouse handovers and bad address data drag courier metrics down unfairly. Clean your side of the data first.
- Setting weights once and forgetting them. Revisit quarterly. A brand shifting from COD to prepaid should re-weight RTO and remittance metrics accordingly.
- Not sharing scores with couriers. The scorecard’s biggest behavioral effect comes from couriers knowing they are being measured against peers.
Conclusion: Measure First, Then Rank, Then Route
Let’s recap. A courier performance scorecard turns courier partner evaluation from guesswork into a repeatable system: pick the courier performance metrics that match your pain points, weight them by business priority, score every partner monthly against defined scales, segment by lane, and act on the results through volume shifts, QBRs, and exit rules.
The benchmarks to aim for: 95%+ on-time delivery, 80%+ first attempt success, delivery success above 85%, and RTO under 10% (under 5% if you want to be in the top tier).
Most importantly, connect the scorecard to action. Data that ranks your couriers but never changes where the next order ships is just a prettier spreadsheet.
Ready to stop guessing? Metaport gives you courier-wise performance dashboards, automated weight dispute tracking, and an allocation engine that routes every order to the best courier for that pincode, automatically. Book a demo and turn your shipping data into your competitive edge.
Frequently Asked Questions
A courier performance scorecard is a weighted evaluation tool that scores each courier partner on KPIs like on-time delivery rate, RTO rate, first attempt delivery rate, cost per shipment, and COD remittance cycle, producing a comparable score out of 100. You need one because rate cards do not reveal true courier performance. The scorecard exposes which partners protect your margin and which ones quietly erode it through delays, disputes, and returns.
Start with eight core metrics: on-time delivery rate (OTD), first attempt delivery rate (FADR), delivery success rate, RTO rate, NDR resolution speed, weight discrepancy rate, cost per shipment, and COD remittance cycle. As you mature, add claim ratio, billing accuracy, reverse pickup success rate, tracking scan quality, and courier-wise NPS. Weight each KPI by business priority so the total adds up to 100.
An on-time delivery rate of 95% or higher is a solid standard, with top performers reaching 98%+. For RTO, under 10% is good and under 5% is excellent for D2C brands. COD-heavy categories like fashion can see 20 to 40% RTO, which makes courier selection and smart allocation critical in those segments.
Use the same weighted scoring model for every partner, pull data from a single source of truth (your shipping platform, not each courier’s dashboard), and segment scores by zone or lane rather than relying on national averages. Compare effective cost per shipment (including surcharges, weight disputes, and RTO freight) instead of rate cards. Review monthly and hold quarterly business reviews with each partner.
Yes, if you act on it. Brands that route orders by lane-level scorecard data, sending COD orders in risky pincodes to the courier with the best first attempt delivery rate there, consistently cut RTO. On costs, tracking weight discrepancy rate and billing accuracy per courier typically recovers 1 to 3% of freight spend, and performance-backed rate negotiations recover more. Pairing the scorecard with an AI courier allocation engine automates these gains order by order.

Kapil Pathak is a Senior Digital Marketing Executive with over six years of experience in the logistics and supply chain industry. He specializes in SEO, SEM, and multi-channel campaign management. He has a strong track record of building strategies that boost brand visibility and generate qualified leads. His work focuses on driving growth for D2C and B2B technology companies through data-driven digital marketing initiatives.