Most D2C founders can recite their CAC, AOV, and contribution margin from memory, but go quiet when you ask what their RTO rate was last month. That blind spot is expensive. Shipping is where 10–15% of an order’s value disappears, and in India another 20–30% of shipments can leak back to you as failed deliveries. If you are not tracking the right d2c shipping metrics, you are running your unit economics with one eye closed. This guide breaks down the ecommerce shipping KPIs that actually move margins, the India benchmarks for each, and how to turn them into a shipping KPI dashboard you can review every week. There is also a free downloadable template at the end so you do not have to build it from scratch.

By the time you finish, you will know exactly which shipping metrics to track, how to calculate each one, what “good” looks like, and which lever to pull when a number drifts into the red.
Why Shipping Metrics Decide D2C Margins
Marketing gets all the dashboards. Logistics gets a spreadsheet someone updates when there is time. Yet for a typical Indian D2C brand, fulfillment is the second-largest cost line after the product itself, and it is the one most likely to quietly erode contribution margin without anyone noticing.
Consider how the money actually leaks. A return-to-origin order does not just cost you the forward shipping; it costs the reverse leg too, plus the blocked working capital, the re-packaging, and the lost sale. Industry data puts RTO at 20–25% of shipments for many Indian D2C brands, and roughly a quarter of all shipments can end up as RTO in cash-on-delivery-heavy categories. A weight discrepancy you never disputed adds a surcharge to every parcel. A surge in WISMO (“where is my order”) tickets pulls your support team off revenue work. None of these show up on a marketing dashboard, but together they can be the difference between a profitable order and a loss-making one.
This is why logistics KPIs for ecommerce belong next to your growth metrics, not buried in an ops folder. When you measure shipping with the same rigor you apply to ad spend, three things happen: you spot leaks before they compound, you negotiate from data instead of gut feel, and you make courier and routing decisions that protect margin. The d2c logistics metrics in this guide are the ones that consistently separate brands that scale profitably from brands that scale their losses.
KPI vs Metric: What’s the Difference?
Before the list, one quick distinction that trips up a lot of teams. A metric is any raw number you can measure: average delivery time, shipment cost, number of NDRs. A KPI is a metric you have attached a target and a business outcome to. “We delivered in 4.1 days on average” is a metric. “We need average delivery time under 4 days to protect our repeat rate, and we are at 4.1” is a KPI.
The practical takeaway: do not drown in metrics. Pick the handful of shipping metrics to track that map directly to margin, retention, and cash flow, give each a benchmark, and ignore the vanity numbers. The dozen ecommerce fulfillment metrics below are the ones worth the dashboard space.
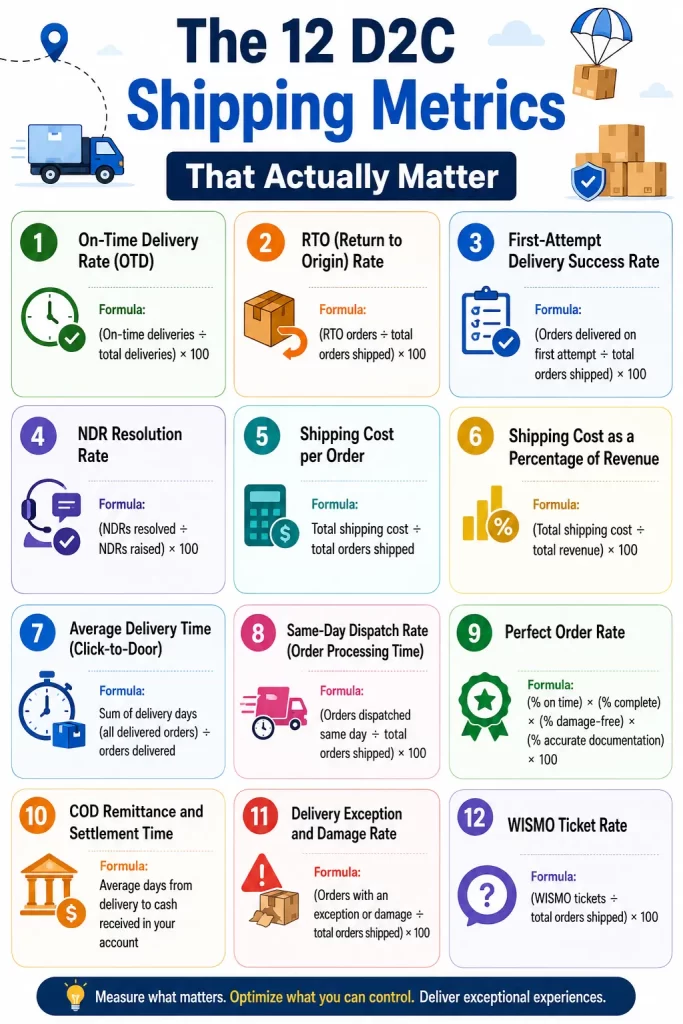
The 12 D2C Shipping Metrics That Actually Matter
Each metric below comes with its formula, an India benchmark, and the reason it earns a spot on your shipping KPI dashboard. Track them monthly at minimum; the fast-moving ones (RTO, NDR, on-time delivery) reward a weekly review.
1. On-Time Delivery Rate (OTD)
Formula: (On-time deliveries ÷ total deliveries) × 100
On-time delivery rate is the percentage of orders that reach the customer by the promised date. If you delivered 870 of 1,000 orders on time, your OTD is 87%. It is the single clearest read on carrier on-time performance and SLA adherence.
Benchmark: Best-in-class operations hold OTD at 95% or higher; the industry average sits between 85–90%. Anything below 90% points to a systemic problem, not bad luck, often a specific carrier or lane that is consistently slipping. OTD feeds directly into customer retention: a missed delivery window is one of the fastest ways to lose a first-time buyer, and roughly 70% of customers are less likely to reorder after one.
2. RTO (Return to Origin) Rate
Formula: (RTO orders ÷ total orders shipped) × 100
This is the metric that quietly kills D2C margins. Return to origin happens when an order cannot be delivered and comes back to you, double shipping cost and zero revenue. RTO rate calculation is simple, but the number is brutal: the India average runs 20–25%, and in COD-heavy categories RTOs can touch 25–30% of shipments.
Benchmark: Keep RTO under 10%. The biggest drivers are bad addresses, unserviceable pincodes, COD cancellations, and weak non-delivery follow-up. This is where smart courier allocation earns its keep: routing each order to the carrier with the best delivery success in that pincode can move RTO several points on its own. If you want the deep dive, see Metaport’s guide on how to reduce RTO with smart courier allocation.
3. First-Attempt Delivery Success Rate
Formula: (Orders delivered on first attempt ÷ total orders shipped) × 100
Every failed first attempt is a fork in the road: either the courier re-attempts, or the order slides toward RTO. First attempt delivery success rate is therefore one of the most predictive leading indicators you have. Brands that track it by pincode routinely find a cluster of problem areas dragging the whole number down.
Benchmark: Above 85% is healthy; strong carriers deliver around 88% on first attempt. Below 80% and you have a serviceability or address-quality problem worth fixing upstream. Tracking this as a KPI has helped founders cut RTO by 20% simply by identifying the pincodes where delivery kept failing.
4. NDR Resolution Rate
Formula: (NDRs resolved ÷ NDRs raised) × 100
A non-delivery report (NDR) is raised every time a delivery attempt fails. NDR resolution rate measures how many of those you rescue, through a re-attempt, an updated address, or a new delivery slot, before they become RTO. It is the difference between a courier that fights for the delivery and one that marks it RTO after a single knock.
Benchmark: A good operation resolves 40–60% of NDRs into successful deliveries. Below 30% means orders are being written off after the first failed attempt. Speed is everything here: act within 24 hours, 48 at the most, because the longer an NDR sits, the higher the RTO odds. Done well, NDR automation recovers 25–35% of cases that would otherwise have been lost, cutting your overall RTO rate by 15–30%. If NDR and RTO are new territory, start with what NDR and RTO mean in ecommerce.
5. Shipping Cost per Order
Formula: Total shipping cost ÷ total orders shipped
This is your fulfillment cost per order at the most basic level, and it is the number to watch when freight rates creep up or your parcel mix shifts heavier. Track it alongside the next metric, because an absolute rupee figure only means something relative to order value.
Benchmark: Keep shipping cost per order below roughly 8–10% of your average order value. Watch for two silent inflators: weight discrepancy surcharges (where the courier bills you for a higher weight than you declared) and the hidden cost of manual freight reconciliation, which lets billing errors slip through. Automating that reconciliation, covered in Metaport’s piece on the hidden cost of manual freight reconciliation, often recovers 2–5% of freight spend that was leaking through unchecked invoices.
6. Shipping Cost as a Percentage of Revenue
Formula: (Total shipping cost ÷ total revenue) × 100
If you only track one cost metric, make it this one. Shipping cost as a percentage of revenue is the cleanest single read on whether logistics is eating your contribution margin. It rolls up freight, surcharges, and the carrying cost of RTO into one comparable number you can trend month over month.
Benchmark: Keep it under 10%. When it drifts above 15%, the culprit is usually some combination of rising RTO, weight surcharges, and an unfavorable COD vs prepaid split. This metric is also your best ammunition in rate negotiations: walk into a carrier review with twelve months of this trend and you negotiate from evidence, not hope.
7. Average Delivery Time (Click-to-Door)
Formula: Sum of delivery days (all delivered orders) ÷ orders delivered
Average delivery time, sometimes called click-to-door time, measures the full journey from order placed to parcel in hand. It combines order processing time, in-transit time, and last-mile delivery into one customer-facing number. It is worth breaking down by zone, because a national average hides the metros-versus-tier-3 gap that actually drives customer expectations.
Benchmark: There is no universal target; set one per zone against your promised EDD. What matters is that actual delivery time stays inside the estimated delivery date you show at checkout. Faster, more accurate delivery lifts conversion, and an accurate AI estimated delivery date at checkout both raises conversion and reduces the gap between promise and reality that generates complaints.
8. Same-Day Dispatch Rate (Order Processing Time)
Formula: (Orders dispatched same day ÷ total orders shipped) × 100
This is the part of delivery speed you fully control. Order processing time, or dispatch SLA, measures how fast an order moves from “placed” to “handed to the carrier.” Same-day dispatch rate turns that into a trackable KPI. It is also a clean diagnostic: if processing routinely exceeds 24 hours, the bottleneck is inside your warehouse, not on the road.
Benchmark: Aim for same-day dispatch on 90%+ of orders placed before your daily cutoff. Below 70% and you are losing delivery-speed advantage before the courier even arrives. This is one of the easiest numbers to improve through dispatch automation, which is why it belongs on the dashboard.
9. Perfect Order Rate
Formula: (% on time) × (% complete) × (% damage-free) × (% accurate documentation) × 100
Perfect order rate is the composite quality metric: the share of orders that arrive on time, complete, undamaged, and correctly documented. Because it multiplies four components, it is unforgiving, which is exactly why it is valuable. A 95% score on each of four dimensions still nets a perfect order rate of only about 81%, so the number forces you to see fulfillment accuracy as a whole, not as four separate stats.
Benchmark: Best-in-class sits in the high-90s. The components also point you straight at the fix: a low damage rate sub-score means packaging or handling; a low documentation-accuracy sub-score means invoicing or labeling. Roughly 1 in 4 returns trace back to order accuracy errors, so this metric protects both margin and reverse logistics cost.
10. COD Remittance and Settlement Time
Formula: Average days from delivery to cash received in your account
For any brand with a meaningful COD share, this is a cash-flow KPI, not a logistics footnote. COD remittance time measures how long your money sits with the courier after the customer pays. Long or unpredictable settlement cycles strangle working capital even when sales look healthy.
Benchmark: Shorter and more predictable is the whole game. Track remittance time and reconcile every COD statement against your orders, because mismatches and delayed payouts are common and rarely flagged for you. Pairing this with a push to convert COD orders to prepaid, where every prepaid order removes RTO risk and remittance lag at once, is one of the highest-leverage moves a COD-heavy brand can make.
11. Delivery Exception and Damage Rate
Formula: (Orders with an exception or damage ÷ total orders shipped) × 100
A delivery exception is anything that interrupts the normal flow: a delay, a misroute, a damaged parcel, an address issue. Exception rate and damage rate together act as an early-warning system. A spike usually shows up here days before it shows up in your RTO or returns numbers.
Benchmark: Keep both as low as possible and trend them by carrier. A carrier whose damage rate is creeping up is costing you in replacements, returns, and reviews long before it appears in a quarterly review. This is a core input to any honest courier performance scorecard.
12. WISMO Ticket Rate
Formula: (WISMO tickets ÷ total orders shipped) × 100
WISMO (“where is my order”) tickets are the support cost of poor shipment visibility. When customers cannot see where their order is, they ask you, and every ticket is staff time spent on something proactive tracking should have answered. WISMO rate is therefore a proxy for the quality of your tracking and EDD communication.
Benchmark: Lower is better, and the fix is usually not more support staff but better self-serve tracking. Branded tracking pages with accurate status updates measurably cut inbound volume; Metaport’s data-backed look at how branded tracking pages cut WISMO tickets shows the mechanism. A falling WISMO rate is also a quiet signal that your customer experience, and with it retention, is improving.
Benchmarks at a Glance
Here is the full set of d2c shipping metrics with their benchmarks in one view, the same structure mirrored in the downloadable dashboard.
| Metric | Formula | Good Benchmark | Red Flag |
|---|---|---|---|
| On-Time Delivery Rate | On-time ÷ total delivered | 95%+ | Below 90% |
| RTO Rate | RTO ÷ total shipped | Under 10% | Above 20% |
| First-Attempt Success | First-attempt ÷ total shipped | Above 85% | Below 80% |
| NDR Resolution Rate | Resolved ÷ raised | 40–60% | Below 30% |
| Shipping Cost per Order | Total cost ÷ orders | Under 10% of AOV | Above 15% of AOV |
| Shipping Cost % of Revenue | Cost ÷ revenue | Under 10% | Above 15% |
| Average Delivery Time | Sum of days ÷ delivered | Inside promised EDD | Slipping vs promise |
| Same-Day Dispatch Rate | Same-day ÷ total | 90%+ before cutoff | Below 70% |
| Perfect Order Rate | OTD × complete × damage-free × accurate | High-90s | Below 90% |
| COD Remittance Time | Days delivery to cash | Short, predictable | Long, erratic |
| Delivery Exception / Damage Rate | Exceptions ÷ total | As low as possible | Rising vs carrier avg |
| WISMO Ticket Rate | WISMO ÷ total | Falling | Rising |
How to Build Your Shipping KPI Dashboard
A list of metrics only helps if it lives somewhere you actually look. The goal is a single shipping KPI dashboard that updates from your courier or aggregator data and gives you a weekly read on the health of fulfillment. You do not need expensive analytics software to start; a well-built spreadsheet that pulls the raw counts from your panel exports will take you a long way.
Build it in three layers. First, an inputs layer: the raw monthly or weekly counts straight from your courier panel, total orders shipped, on-time deliveries, RTO orders, NDRs raised and resolved, shipping cost, revenue, and so on. Second, a calculations layer that turns those counts into the KPIs above using fixed formulas, so the math never changes and human error stays out of it. Third, a status layer that compares each KPI to its benchmark and flags it green or red automatically, so your eye goes straight to what needs attention.
Review it on a weekly cadence for the fast-movers (RTO, NDR resolution, first-attempt success, on-time delivery) and monthly for the cost and quality metrics. The point is not to admire the numbers but to act on the red flags. When RTO spikes, dig into pincode-level first-attempt data and your courier allocation logic. A climbing shipping-cost-as-percentage-of-revenue figure is your cue to reconcile freight invoices and check for weight discrepancies. And rising WISMO tickets point straight to your tracking experience and EDD accuracy.
This is also where the right platform changes the math. Smart, AI-driven courier allocation routes each order to the carrier with the best track record in that pincode, which lifts first-attempt success and pushes RTO down. Automated NDR management chases failed deliveries within hours instead of days, recovering orders that manual follow-up would lose. Multi-carrier shipping from a single dashboard, automated freight reconciliation, branded tracking pages, and dispatch automation each map to specific metrics on this list, and together they move the whole scorecard. Metaport’s own background on why AI courier allocation is crucial for ecommerce brands walks through how the allocation engine drives several of these KPIs at once.
If you would rather not build the spreadsheet yourself, the free template below already has all twelve metrics, their formulas, India benchmarks, and automatic green/red status flags wired in. Plug in your monthly numbers and the dashboard does the rest.
How Metaport Helps You Hit These Benchmarks
Tracking the metrics tells you where you are bleeding; the platform is what stops the bleed. Metaport is built around the exact KPIs in this guide. Its AI courier allocation targets RTO rate and first-attempt delivery success by sending every order to the best-performing carrier for that destination. Automated NDR management lifts your NDR resolution rate by acting inside the 24–48 hour window that decides whether an order is saved or written off. Multi-carrier shipping and automated freight reconciliation protect shipping cost per order and shipping cost as a percentage of revenue by catching weight discrepancies and surfacing the cheapest viable route. Branded tracking pages drive down WISMO tickets and lift the post-purchase customer experience that powers retention.
In other words, the same dashboard that exposes the problem points at the solution. Measure the d2c shipping metrics that matter, then close the gap between your numbers and the benchmark, one lever at a time.
The Bottom Line
You cannot improve what you do not measure, and in D2C, the metrics you are not measuring are usually the ones costing you the most. Shipping is not a back-office chore; it is a profit lever sitting in plain sight. Track the twelve d2c shipping metrics in this guide, benchmark each against the India numbers above, and review them weekly, and you will catch margin leaks while they are still small enough to fix.
Download the free KPI dashboard template below, drop in last month’s numbers, and see exactly where you stand against the benchmarks. Then, if you want the platform that turns those red flags green, book a Metaport demo and put your shipping metrics to work.
Frequently Asked Questions
The metrics that map directly to margin, cash flow, and retention: RTO rate, on-time delivery rate, first-attempt delivery success, NDR resolution rate, shipping cost as a percentage of revenue, and perfect order rate. Start with these six before adding the rest of the dashboard.
Aim to keep return-to-origin under 10% of shipments. The India average runs higher, around 20–25%, and can reach 25–30% in COD-heavy categories. Anything consistently above 20% signals address-quality, pincode-serviceability, or weak NDR follow-up problems worth fixing.
Divide the number of orders delivered by the promised date by total deliveries, then multiply by 100. For example, 870 on-time deliveries out of 1,000 gives an 87% on-time delivery rate. Aim for 95% or higher; below 90% indicates a systemic issue.
A healthy first-attempt delivery success rate is above 85%, and strong carriers reach roughly 88%. Below 80% usually means a serviceability or address-quality problem. Tracking it by pincode often reveals a small cluster of areas dragging the overall number down.
NDR resolution rate is the share of failed deliveries you recover before they become RTO, calculated as NDRs resolved divided by NDRs raised. A healthy rate is 40–60%; below 30% means orders are written off after one failed attempt. Resolve NDRs within 24–48 hours for the best results.
Keep shipping cost per order below roughly 8–10% of your average order value, and shipping cost as a percentage of revenue under 10%. Watch for weight discrepancy surcharges and unreconciled freight invoices, which silently push both numbers higher.

Kapil Pathak is a Senior Digital Marketing Executive with over five years of experience in the logistics and supply chain industry. He specializes in SEO, SEM, and multi-channel campaign management. He has a strong track record of building strategies that boost brand visibility and generate qualified leads. His work focuses on driving growth for D2C and B2B technology companies through data-driven digital marketing initiatives.