Your Meta dashboard says 3.3x ROAS. The team is happy. Budgets go up.
Then the month closes, and the bank balance tells a different story.
So what happened?
For most Indian D2C brands, the answer is RTO (Return to Origin). A chunk of the orders your ads “won” never reached a customer. They travelled across the country, failed delivery and came back to your warehouse. You paid for the click, the shipment out and the shipment back. You earned nothing.
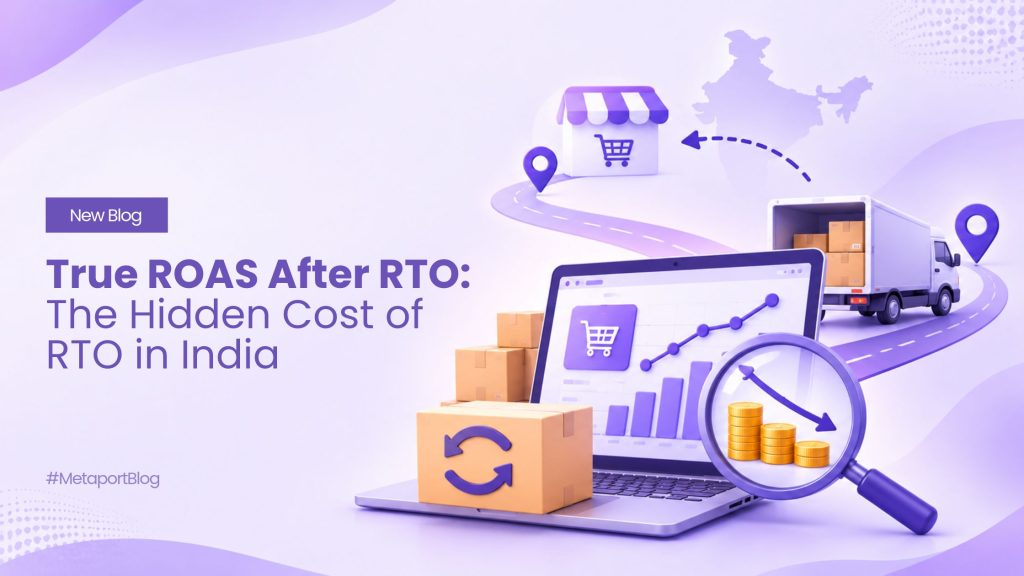
The tricky part is that your ad dashboard has no idea. It counts the sale the moment the order is placed, not when the parcel is accepted.
In this guide, you’ll learn:
- Why platform ROAS overstates your real returns
- The full cost of RTO in ecommerce, line by line
- How to calculate your true ROAS after RTO, with a worked example
- Why Meta and Google can actually make RTO worse over time
- Six practical fixes, from checkout to ad signals
Let’s start with what ROAS really measures.
What ROAS Measures (and What It Quietly Leaves Out)
ROAS stands for Return on Ad Spend. The formula is simple:
ROAS = Revenue from ads ÷ Ad spend
Spend ₹1 lakh, bring in ₹4 lakh in orders, and your ROAS is 4x. Easy.
But here’s the catch. “Revenue” in that formula means orders placed, not money received. Your ad platform has no way to know what happens after checkout.
Gross Revenue vs Net Revenue
Think of it like a restaurant that counts every table reservation as a paid bill. That includes the no-shows. The numbers look great until someone checks the cash drawer.
That’s the gap between two kinds of revenue:
- Gross revenue: every order placed, including ones that will be cancelled or returned
- Net revenue: what’s left after cancellations, RTO and customer returns
Analytics platforms like Triple Whale advise basing ROAS on net revenue for exactly this reason. Gross numbers paint a picture that is too rosy.
Why the Gap Is Wider in India
In many markets, the gap between gross and net is small. In India, it can be huge. A few reasons stand out:
- Cash on delivery is common. A COD buyer has spent nothing at checkout, so walking away costs them nothing.
- Impulse orders are easy. A scroll, a tap and an order is placed, with zero commitment.
- Addresses are messy. Landmarks, missing pincodes and incomplete details cause failed attempts, especially in tier 2 and tier 3 cities.
- Delivery windows are long. The longer a parcel takes, the more time a buyer has to change their mind.
It also helps to separate RTO from regular returns. A return is a customer who received the product and sent it back. An RTO is an order that never got delivered at all. If you need a refresher, here’s our guide on what NDR and RTO mean in ecommerce.
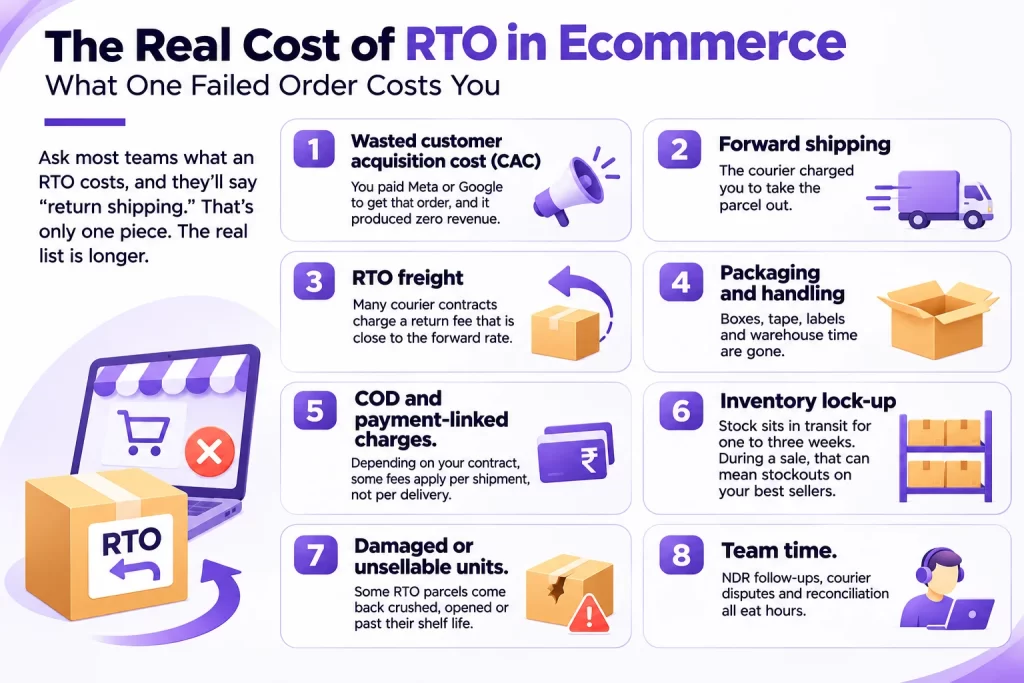
The Real Cost of RTO in Ecommerce: What One Failed Order Costs You
Ask most teams what an RTO costs, and they’ll say “return shipping.” That’s only one piece. The real list is longer.
Here’s everything you lose when a single order comes back:
- Wasted customer acquisition cost (CAC). This is usually the biggest line. You paid Meta or Google to get that order, and it produced zero revenue.
- Forward shipping. The courier charged you to take the parcel out.
- RTO freight. Many courier contracts charge a return fee that is close to the forward rate.
- Packaging and handling. Boxes, tape, labels and warehouse time are gone.
- COD and payment-linked charges. Depending on your contract, some fees apply per shipment, not per delivery.
- Inventory lock-up. Stock sits in transit for one to three weeks. During a sale, that can mean stockouts on your best sellers.
- Damaged or unsellable units. Some RTO parcels come back crushed, opened or past their shelf life.
- Team time. NDR follow-ups, courier disputes and reconciliation all eat hours.
A Quick Example
Let’s put rough numbers on one failed ₹1,000 order:
| Cost | Amount |
|---|---|
| Ad cost to acquire the order | ₹300 |
| Forward shipping | ₹70 |
| RTO freight | ₹70 |
| Packaging and handling | ₹20 |
| Total lost | ₹460 |
That’s nearly half the order value, gone, with no revenue to show for it. And we haven’t counted damage or inventory lock-up yet.
Your actual figures will vary by category, weight and courier. For a fuller breakdown, see our guide to the true shipping cost per order in India.
How to Calculate True ROAS After RTO
Now let’s fix the math. You only need two extra numbers: delivered revenue and RTO losses.
Step 1: Find Your Delivered ROAS
Delivered ROAS = Revenue from delivered orders ÷ Ad spend
This removes every order that never reached a customer. It’s the simplest correction, and it’s already far more honest than the platform number.
Step 2: Add RTO Losses to Your Costs
Delivered ROAS still ignores the money you burned on failed shipments. So we add those losses back in:
True ROAS after RTO = Delivered revenue ÷ (Ad spend + RTO losses)
Some teams call this RTO adjusted ROAS. Whatever you call it, it shows what your ads really return once logistics catches up.
A Worked Example
Let’s take a D2C brand running one month of Meta ads.
What the dashboard shows:
- Ad spend: ₹3,00,000
- Orders: 1,000
- Average order value: ₹1,000
- Revenue: ₹10,00,000
- Platform ROAS: 3.33x
Looks healthy, right? Now let’s apply a 25% RTO rate.
What actually happened:
- Orders delivered: 750
- Orders returned to origin: 250
- Delivered revenue: ₹7,50,000
- Delivered ROAS: 2.5x
Next, we add up the RTO losses on those 250 orders:
| RTO cost | Calculation | Amount |
|---|---|---|
| Forward shipping | 250 × ₹70 | ₹17,500 |
| RTO freight | 250 × ₹70 | ₹17,500 |
| Packaging and handling | 250 × ₹20 | ₹5,000 |
| Damaged units (about 5%) | 13 × ₹350 product cost | ₹4,550 |
| Total RTO losses | ₹44,550 |
Now the final number:
True ROAS after RTO = ₹7,50,000 ÷ (₹3,00,000 + ₹44,550) = 2.18x
So the “3.33x campaign” is really a 2.18x campaign. That’s a drop of roughly a third, and nothing on the ad dashboard warned you.
Your cost per delivered order tells the same story. The platform says ₹300 per order. In reality, you paid ₹400 for every order that reached a customer (₹3,00,000 ÷ 750).
From ROAS to POAS: Is the Campaign Actually Profitable?
ROAS tells you about revenue. But revenue isn’t profit. That’s where POAS (Profit on Ad Spend) comes in.
POAS = Contribution after variable costs ÷ Ad spend
Let’s continue the same example. Assume a 60% gross margin and that 60% of delivered orders were COD.
- Gross margin on delivered revenue: ₹4,50,000
- Minus forward shipping on 750 delivered orders: ₹52,500
- Minus COD fees on 450 COD orders at ₹30 each: ₹13,500
- Minus RTO losses: ₹44,550
- Contribution before ads: ₹3,39,450
POAS = ₹3,39,450 ÷ ₹3,00,000 = 1.13
In plain words, the campaign made about ₹39,450 after ad costs. That’s a thin margin on ₹3 lakh of spend.
Now here’s the scary part. What if RTO climbs from 25% to 35%? That’s common during sales or when you test new audiences.
Run the same math, and the campaign loses about ₹29,500. Same ads. Same creatives. Same platform ROAS. The only thing that changed was RTO.
What’s Your Breakeven ROAS?
Breakeven ROAS is the lowest ROAS at which a campaign stops losing money. Most brands calculate it on gross revenue, which hides RTO entirely.
A better version:
Breakeven ROAS = 1 ÷ Contribution margin per ₹1 of delivered revenue
In our example, every ₹1 of delivered revenue leaves about 45 paise after product cost, shipping, COD fees and RTO losses (₹3,39,450 ÷ ₹7,50,000). So:
Breakeven delivered ROAS = 1 ÷ 0.45 = about 2.2x
The campaign’s delivered ROAS was 2.5x, just above the line. That’s why a 10-point jump in RTO tips it into a loss.
Why Meta and Google Ads Make RTO Worse
Here’s something many founders don’t realise. RTO doesn’t just hurt your numbers. Left unchecked, your ad platforms can actually increase it over time.
The Algorithm Optimizes for the Wrong Event
Most D2C campaigns optimize for the “Purchase” event. That event fires when someone places an order.
To Meta, these two orders look identical:
- A prepaid order that gets delivered and loved
- A COD order that gets refused at the door
Both count as a purchase. Both teach the algorithm, “Find me more people like this.”
Worse still, a buyer who has refused three COD orders looks like a loyal repeat customer. The platform sees three purchases and wants more of them.
The Feedback Loop That Quietly Raises RTO
Here’s how the cycle usually plays out:
- Impulse COD buyers convert easily, because checkout costs them nothing.
- The algorithm notices and finds more of them.
- Your cost per purchase looks great, so you scale the campaign.
- More COD impulse orders flow in.
- RTO climbs, while platform ROAS stays flat or even improves.
It’s a bit like training a sniffer dog with the wrong scent. The dog works hard and gets very good at finding the wrong thing.
Broad Targeting Amplifies Bad Signals
Automated campaign types like Advantage+ lean heavily on your conversion data to find buyers. When that data is noisy, the automation amplifies the noise.
The fix isn’t to drop automation. It’s to feed the platform better signals, which we’ll cover in the fixes below.
Warning Signs That RTO Is Eating Your ROAS
Not sure if this is happening to you? Look for these red flags:
- ROAS is steady, but profit keeps falling. This is the classic symptom.
- COD remittances don’t match dashboard revenue. The gap widens month after month.
- Your “best” campaigns have the highest COD share. The lowest cost per purchase often hides the highest RTO.
- RTO clusters in certain pincodes or states. Your ads may be spending heavily in zones where delivery keeps failing.
- RTO spikes during sales and new-audience tests. Discounts and cold audiences attract more impulse buyers.
- Your first attempt delivery rate is slipping. A falling first attempt delivery rate (FADR) is often the earliest warning sign of rising RTO.
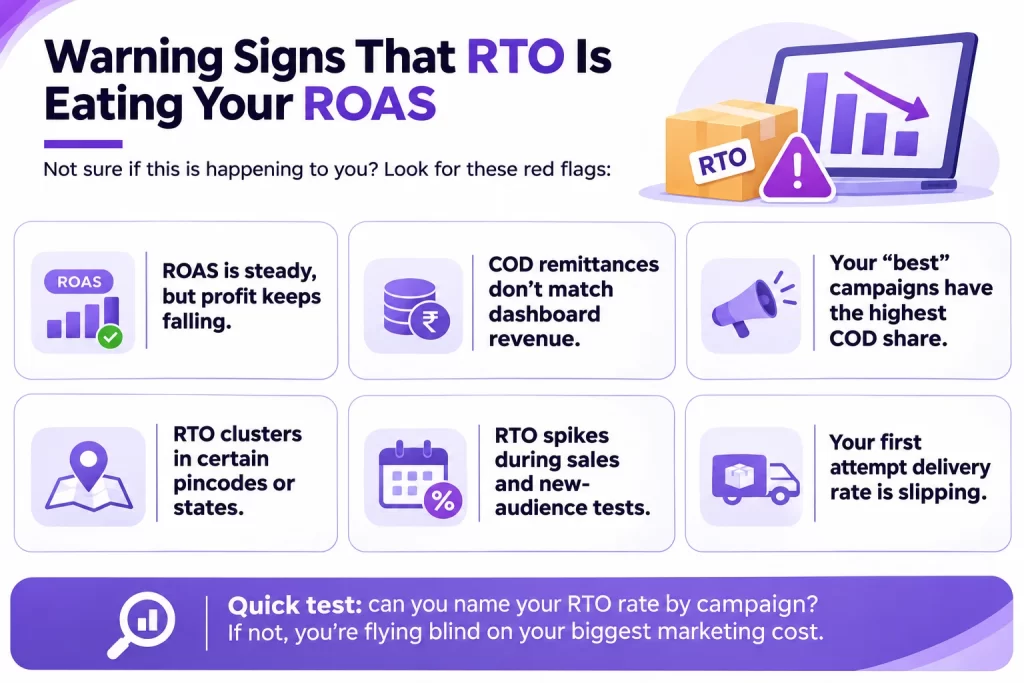
Here’s a quick test: can you name your RTO rate by campaign? If not, you’re flying blind on your biggest marketing cost.
How to Reduce RTO and Protect Your ROAS: 6 Practical Fixes
The good news? RTO isn’t fate. Most of it is preventable, and the fixes work at different points in the order journey.
1. Shift COD Buyers to Prepaid
Prepaid orders RTO far less often, because the buyer has already committed money.
You don’t need to kill COD. Instead, nudge buyers toward prepaid:
- Offer a small prepaid discount or free shipping on prepaid
- Add a modest COD handling fee
- Try partial COD, where the buyer pays a small amount upfront
- Send a payment link on WhatsApp after a COD order is placed
Our full playbook on how to convert COD orders to prepaid walks through each option.
2. Validate Addresses at Checkout
A large share of failed deliveries start with a bad address. Missing house numbers, wrong pincodes and vague landmarks all lead to “customer not reachable.”
Fix it before the order is even confirmed:
- Auto-suggest addresses based on the pincode
- Flag addresses that are too short or missing key fields
- Check pincode serviceability before showing COD
Read more in our guide to address validation for ecommerce in India.
3. Confirm High-Risk COD Orders Before Dispatch
Not every COD order carries the same risk. A high-value order to a new customer in a high-RTO pincode deserves a second look.
A simple process:
- Score each COD order by pincode history, order value and customer history
- Send a WhatsApp or IVR confirmation for risky orders
- Hold or cancel orders that stay unconfirmed after a set time
Cancelling an order before dispatch costs you almost nothing. Shipping it and getting it back costs you hundreds.
4. Allocate Couriers Based on Pincode Performance
Your courier choice matters more than most brands think. One courier may deliver beautifully in Bengaluru and struggle badly in rural Bihar.
Instead of sending everything through one partner, route each order to the courier with the best delivery record for that pincode. This lifts first-attempt success, which directly lowers RTO.
We’ve covered the method in detail in how to reduce RTO with smart courier allocation.
5. Act Fast on Failed Delivery Attempts
When a delivery attempt fails, the clock starts ticking. Most couriers make only a limited number of attempts before marking a parcel for return.
The faster you reach the buyer, the more orders you save:
- Contact the buyer on WhatsApp or by call within hours, not days
- Let them pick a new time slot or correct the address
- Escalate suspicious “customer refused” reasons with the courier
Doing this by hand doesn’t scale past a few hundred orders a day. That’s where NDR management software earns its keep.
6. Send Delivered Orders Back to Your Ad Platforms
This is the fix most logistics guides skip. Yet it attacks the root of the problem: the algorithm’s bad training data.
Meta’s Conversions API lets you send events from your own server, not just from the browser. That means you can tell Meta what really happened after checkout.
Here’s a practical approach:
- Create separate events such as “prepaid purchase” and “order delivered.”
- Send delivery and RTO status to Meta as soon as the courier updates it.
- Optimize toward delivered orders once you have enough event volume. If volume is low, start with prepaid purchases and work up from there.
- Exclude repeat RTO buyers from your retargeting audiences.
Once the platform learns what a delivered customer looks like, it starts finding more of them. Over time, that improves both your RTO rate and your true ROAS.
This setup usually sits with your marketing or tech team, often with help from an attribution or CAPI tool. The one thing it depends on is accurate, timely delivery and RTO status. So the cleaner your shipping data, the better your ad signals will be.
Build a Weekly RTO-Adjusted ROAS Dashboard
You can’t fix what you don’t measure. Add these metrics to your weekly review:
| Metric | What it tells you |
|---|---|
| Platform ROAS | What the ad dashboard claims |
| Delivered ROAS | Revenue from orders that actually arrived |
| True ROAS after RTO | Returns after counting RTO losses |
| RTO rate by campaign | Which campaigns attract risky buyers |
| COD share by campaign | Early warning for future RTO |
| Cost per delivered order | Your real acquisition cost |
| RTO rate by pincode cluster | Where to tighten COD or switch couriers |
| First attempt delivery rate | How well couriers perform on the first try |
One tip on timing: RTO takes time to show up. An order placed today may not return for two or three weeks. So measure RTO on orders shipped at least 14 to 21 days ago, not on last week’s orders.
Also, review the dashboard with both marketing and operations in the room. RTO is not just an ops problem or a marketing problem. It’s both.
Conclusion: Stop Scaling Revenue That Walks Back to Your Warehouse
Platform ROAS isn’t wrong. It’s just incomplete. In a COD-heavy market like India, the gap between “orders placed” and “money earned” can quietly erase your profit.
Let’s recap:
- Platform ROAS counts orders, not deliveries. It ignores every parcel that comes back.
- The cost of RTO goes far beyond return shipping. Wasted ad spend is usually the biggest loss.
- True ROAS after RTO = delivered revenue ÷ (ad spend + RTO losses). In our example, 3.33x became 2.18x.
- A 10-point rise in RTO can flip a profitable campaign into a loss, with no change in creatives or platform ROAS.
- Ad platforms can make RTO worse when they’re trained on placed orders instead of delivered ones.
- Fixes work at every stage: prepaid nudges, address checks, COD confirmation, smart courier allocation, fast NDR action and better ad signals.
Before you raise next month’s ad budget, ask one question: how much of this revenue will actually arrive?
Metaport helps D2C brands answer that question. It brings RTO, NDR and courier performance into one view by pincode and courier, so you can see where failed deliveries start and fix them before they eat your ad spend. Book a demo and see your RTO-adjusted numbers.
Frequently Asked Questions
There’s no single benchmark, because RTO varies widely by category, payment mix and region. COD-heavy categories like fashion usually see higher rates than prepaid-heavy ones. Instead of chasing an industry number, track your own RTO by campaign, courier and pincode, and aim to lower it every quarter.
Divide your delivered revenue by your ad spend plus RTO losses. RTO losses include forward shipping, return freight, packaging and damaged units on every returned order. This RTO adjusted ROAS shows what your ads return once failed deliveries are counted.
ROAS measures revenue per rupee of ad spend. POAS (Profit on Ad Spend) measures profit per rupee, after product cost, shipping, COD fees and RTO losses. A campaign can show strong ROAS and still have a POAS below 1, which means it’s losing money.
No, not by default. Meta records a purchase when the order is placed and never learns what happened afterwards. To change that, send delivery and RTO status through the Meta Conversions API, so the algorithm can learn which buyers actually accept their orders.
Usually not. COD still drives a large share of Indian ecommerce orders, and removing it can hurt conversions badly. A better approach is to manage COD risk: nudge buyers to prepaid, confirm risky orders before dispatch, limit COD in high-RTO pincodes and validate addresses at checkout.

Kapil Pathak is a Senior Digital Marketing Executive with over six years of experience in the logistics and supply chain industry. He specializes in SEO, SEM, and multi-channel campaign management. He has a strong track record of building strategies that boost brand visibility and generate qualified leads. His work focuses on driving growth for D2C and B2B technology companies through data-driven digital marketing initiatives.