Here is a puzzle that confuses a lot of D2C founders. Two brands ship the same product, at the same price, through the same courier. One runs an RTO rate of 8 percent. The other bleeds 25 percent. Same courier, same pin codes, wildly different outcomes.
The difference usually hides in one number that most brands never track: the first attempt delivery rate.
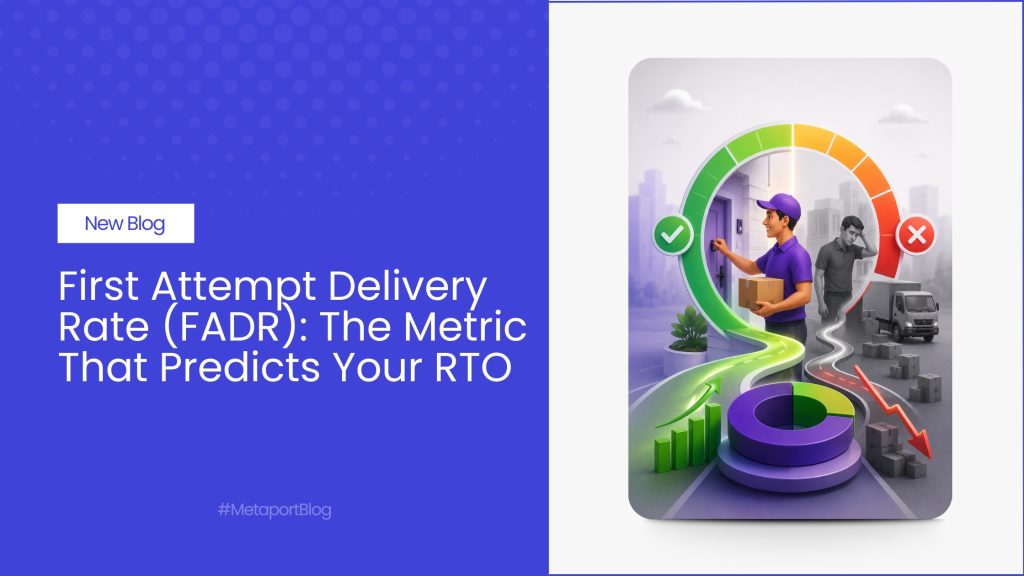
If you sell online in India, FADR is the earliest warning signal you have. It tells you, days before the RTO report lands, which orders are about to come back and eat your margin. Yet most shipping dashboards bury it under vanity metrics like total shipments and average delivery time.
In this guide, we will break down what first attempt delivery rate means, how to calculate it, what a good benchmark looks like in India, why it predicts RTO so reliably, and seven practical ways to push yours above 90 percent. Grab a coffee. This one goes deep.
What Is First Attempt Delivery Rate (FADR)?
First attempt delivery rate is the percentage of shipments that get delivered successfully on the courier’s very first visit to the customer’s address. No reattempts, no “customer not available” updates, no phone calls. The rider shows up once, the customer receives the parcel, done.
Think of it like a first impression. When a delivery succeeds on attempt one, everyone wins. The customer gets their order fast. The courier saves fuel and time. And you, the brand, avoid the messy chain of events that starts the moment an attempt fails.
FADR in logistics goes by a few other names, so do not let the jargon throw you off:
- First attempt delivery success rate
- First-time delivery rate
- FADR or FAD percentage
- First attempt success (FAS)
Whatever your courier partner calls it, the meaning stays the same. Delivered on visit one, or not.
Why does this single number matter so much? Because every failed first attempt kicks off a countdown. The courier raises an NDR (non-delivery report), schedules a reattempt, and the odds of that parcel ever reaching the customer start dropping with each passing day. If you are fuzzy on how that chain works, our explainer on what NDR and RTO mean in ecommerce covers the basics.
How to Calculate First Attempt Delivery Rate
The FADR formula is refreshingly simple. No spreadsheet gymnastics required.
The FADR Formula
FADR = (Deliveries completed on the first attempt ÷ Total deliveries attempted) × 100
That is it. Count the orders delivered on attempt one, divide by everything you shipped out for delivery, and multiply by 100.
A Worked Example
Say your brand dispatched 2,000 orders last month. Here is how they played out:
- 1,720 orders delivered on the first attempt
- 180 orders delivered on the second or third attempt
- 100 orders returned to origin
Your FADR = (1,720 ÷ 2,000) × 100 = 86 percent.
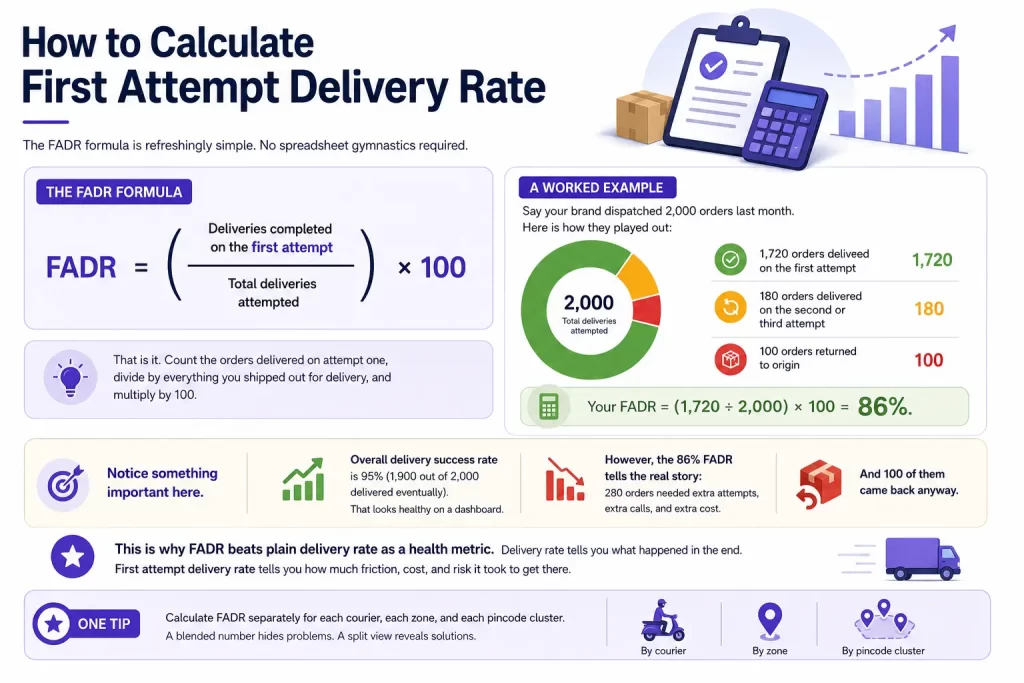
Notice something important here. Your overall delivery success rate is 95 percent (1,900 out of 2,000 delivered eventually). That looks healthy on a dashboard. However, the 86 percent FADR tells the real story: 280 orders needed extra attempts, extra calls, and extra cost. And 100 of them came back anyway.
This is why FADR beats plain delivery rate as a health metric. Delivery rate tells you what happened in the end. First attempt delivery rate tells you how much friction, cost, and risk it took to get there.
One tip: calculate FADR separately for each courier, each zone, and each payment mode. A blended number hides the problem areas. More on that later.
FADR Benchmarks: What Counts as Good in India?
So you have calculated your number. Is it good? Here is how the benchmarks stack up for Indian ecommerce:
- 95 percent and above: Excellent. You are in the top tier of D2C operations.
- 90 to 95 percent: Good. Solid operations with room to squeeze out more.
- 85 to 90 percent: Average. Reattempts are quietly inflating your cost per order.
- Below 85 percent: Trouble. Your RTO rate is almost certainly eating your margin.
For context, the average ecommerce parcel in India takes around 2.3 delivery attempts to reach the customer, according to Edgistify’s research on attempt rates. That average hides huge variation. Metro prepaid orders often land above 92 percent on attempt one. COD orders to Tier 3 pin codes can crash below 70 percent.
Therefore, treat the benchmark as a starting point, not a finish line. A fashion brand shipping 70 percent COD to small towns faces a very different baseline than a supplements brand selling prepaid to metros. Compare your FADR against your own mix, month over month, and against each courier serving the same lanes.
That last comparison matters most. When two couriers serve the same pin codes with the same order profile and one posts an 88 percent FADR while the other manages 79 percent, you have found free money. Shifting volume takes a week. The savings show up immediately.
Why FADR Is the Best Predictor of RTO
Plenty of metrics correlate with returns. So why single out first attempt delivery rate as the one that predicts RTO?
Because the relationship is direct, strong, and measurable. An analysis of roughly 1.2 million parcels found a Pearson correlation of -0.86 between FADR and RTO, as reported by Edgistify. In plain English: when first attempt success goes up, returns go down, almost in lockstep. A correlation that strong is rare in logistics data.
The Failed Delivery Chain
To understand why, follow what happens after a first attempt fails:
- The rider marks the shipment undelivered and an NDR is raised.
- The parcel goes back to the local hub and waits for a reattempt slot.
- By attempt two, the customer’s excitement has cooled. Doubt creeps in.
- For COD orders, the customer has had another day to change their mind or spend the cash.
- After two or three failed attempts, the courier triggers RTO and the parcel heads home.
Every step in that chain lowers the odds of delivery. The customer who eagerly awaited the parcel on day three is a reluctant buyer by day seven. Reattempts are not fresh chances. They are decaying ones.
What a Five-Point FADR Drop Actually Costs
Let us put rupees on it. Suppose you ship 5,000 orders a month at an average order value of Rs 1,200, and your FADR slips from 90 to 85 percent.
- That is 250 additional failed first attempts.
- Reattempts add 20 to 30 percent to per-order delivery cost on those shipments.
- If even 40 percent of those failed attempts convert to RTO, that is 100 extra returns.
- Each RTO costs you forward shipping, return shipping, repackaging, and blocked inventory. For a Rs 1,200 order, the all-in hit often crosses Rs 150 to 250.
In contrast, the brands that treat FADR as a weekly operating metric catch this slide in week one, not in the month-end RTO report. That head start is the entire point. RTO is a lagging indicator. First attempt delivery rate is the leading one. We break down which other numbers deserve that weekly review in our guide to D2C shipping metrics.
Why Do First Delivery Attempts Fail?
You cannot fix what you do not understand. Industry data shows failed first attempts cluster around a handful of causes, and most of them are preventable.
- Customer not available (roughly 36 percent of failures): The rider arrives, nobody answers. Common with office-goers, gated societies, and parcels needing signatures, per SmartRoutes’ delivery statistics.
- Address problems (roughly 22 percent): Missing flat numbers, wrong pin codes, vague landmarks. “Near the temple” works for a neighbour, not for a rider on a deadline.
- COD cash not ready: The customer planned to withdraw cash and forgot. The rider cannot wait, so the attempt fails.
- Doorstep refusal: The customer changed their mind. More common in COD, where nothing was paid upfront.
- Fake delivery attempts: The rider marks “customer not available” without visiting, usually to close out a heavy route. This plagues Tier 2 and Tier 3 lanes, and we wrote a full playbook on handling fake delivery attempts.
- Access issues: Locked gates, strict security desks, or societies that refuse to hold parcels.
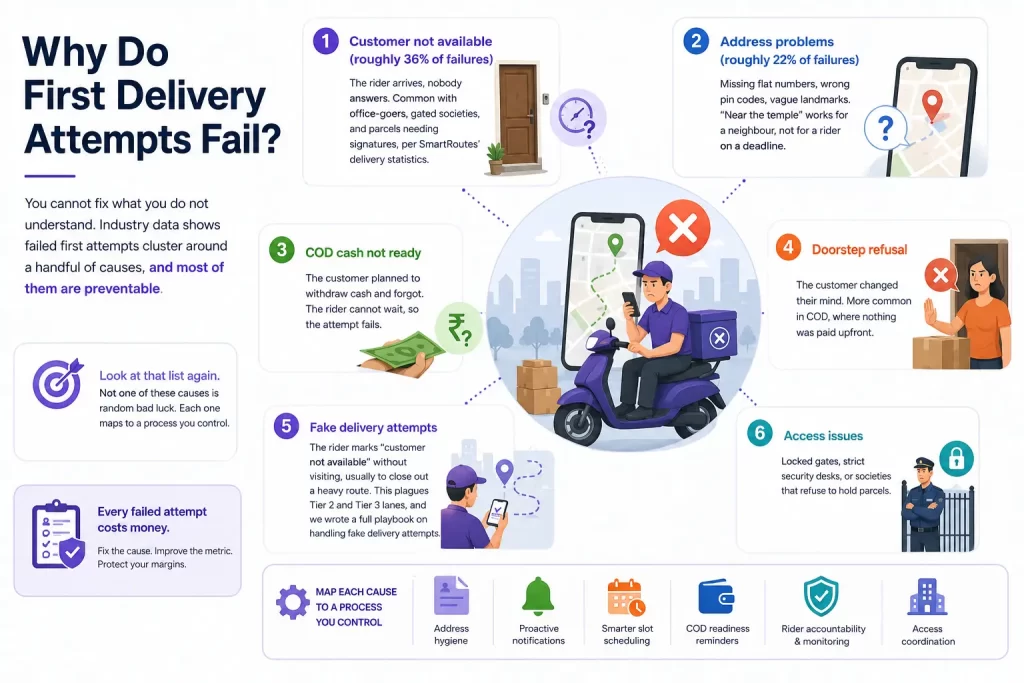
Look at that list again. Not one of these causes is random bad luck. Each one maps to a process you control: address capture, pre-delivery communication, payment mix, or courier accountability. That should feel encouraging.
The COD Factor: Why Cash Orders Drag Your FADR Down
We need to talk about cash on delivery separately, because in India it dominates the failure math.
Around 60 percent of Indian online shoppers still prefer COD. However, COD orders are up to three times more likely to fail delivery than prepaid ones, and an estimated 25 to 30 percent of COD orders end up as RTO, according to Dazeinfo’s analysis of COD failures.
Why the gap? Psychology, mostly. A prepaid customer has skin in the game. A COD customer has placed a reservation, not a commitment. When the rider arrives, that reservation competes with second thoughts, empty wallets, and impulse purchases made since.
Does that mean you should kill COD? No. For most D2C brands in India, COD is 40 to 70 percent of revenue. Killing it kills growth. The smarter play is to manage it:
- Verify COD intent before dispatch with a WhatsApp or IVR confirmation.
- Nudge fence-sitters toward prepaid with small discounts or UPI-on-delivery options.
- Screen high-risk COD orders using pin code and customer history before you ship.
We covered the conversion tactics in detail in our guide on converting COD orders to prepaid. Even shifting 10 percent of your COD volume to prepaid moves your blended FADR noticeably.
How to Improve First Attempt Delivery Rate: 7 Tactics That Work
Now for the practical part. These seven tactics are ordered roughly by effort versus impact. Start at the top.
- 1. Validate Addresses at Checkout
Since bad addresses cause about a fifth of failed attempts, this is the cheapest win available. Add pin code validation, autocomplete, and mandatory fields for flat number and landmark at checkout. Flag serviceability issues before the customer pays, not after.
A two-second check at checkout saves a three-day reattempt cycle later. Few fixes in logistics offer that kind of trade. - 2. Confirm Orders Before Dispatch
For COD orders especially, a simple WhatsApp confirmation (“Reply YES to confirm your order”) filters out impulse buyers and address errors before the parcel leaves your warehouse. Brands using pre-dispatch verification routinely report double-digit drops in NDR volume.
The unconfirmed orders? Hold them for a phone follow-up. Shipping an unverified COD order to a Tier 3 pin code is a coin flip with your shipping budget. - 3. Communicate the Delivery Date, Then Keep the Promise
Remember that 36 percent of failures happen because nobody was home. Customers cannot be available for a delivery they cannot predict. Showing an accurate estimated delivery date at checkout, then sending day-of-delivery alerts, directly attacks the biggest failure cause.
This is where AI-powered estimated delivery dates earn their keep. Accurate EDDs do double duty: they lift checkout conversion and lift FADR, because the customer plans to be home. - 4. Allocate Couriers by Pin Code Performance
Here is the uncomfortable truth about courier performance: no courier is good everywhere. Delhivery might post 92 percent FADR in Jaipur while another partner posts 81 percent, and the ranking might flip completely in Coimbatore.
Flat courier allocation (one courier for everything, or simple rate-based routing) ignores this. Smart courier allocation routes each order to the courier with the best first attempt record for that specific pin code and payment mode. Brands that switch from rate-based to performance-based allocation typically see 30 to 48 percent fewer failed deliveries. Nothing else on this list moves the number that fast at scale. - 5. Act on NDRs Within 24 Hours
When a first attempt does fail, speed decides what happens next. Contact the customer within 24 hours, confirm availability or fix the address, and push the update to the courier before the reattempt. Wait 48 hours or more, and the odds of rescue drop sharply.
Automate this. An NDR workflow that fires a WhatsApp message the moment a failure is logged will outperform any manual calling team on speed, and speed is the whole game here. - 6. Audit for Fake Attempts
If a courier’s “customer not available” rate in certain pin codes looks suspiciously high, verify it. Match NDR timestamps against customer complaints, call a sample of customers, and demand proof-of-attempt data. Fake attempts poison your FADR data and, worse, punish customers who were home all along.
Couriers behave better when they know you are watching. Which brings us to the last tactic. - 7. Put FADR on Your Courier Scorecard
Whatever gets measured in your monthly courier review gets managed by your courier’s regional team. Make first attempt delivery rate a headline metric on your courier performance scorecard, broken down by zone and payment mode. Tie volume allocation to it. Watch how quickly performance conversations change when the data is on the table.
FADR vs Other Last Mile Delivery KPIs
First attempt delivery rate is powerful, but it works best in a small family of metrics. Here is how they fit together:
| Metric | What It Tells You | Blind Spot |
|---|---|---|
| FADR | Friction and RTO risk, early | Says nothing about speed |
| On-time delivery rate | Whether EDD promises were kept | An on-time third attempt still cost you money |
| Attempt rate (avg attempts per parcel) | Total reattempt burden | Averages hide bad lanes |
| RTO percentage | Final damage | Lagging; the money is already lost |
| NDR rate | Volume of failure events | Needs FADR context to spot fake attempts |
The pattern to remember: FADR leads, RTO lags. NDR rate sits in the middle as the event log connecting the two. Track all three, but let FADR drive your weekly decisions, because it moves first.
A quick note on OTIF (on-time, in-full), which enterprise supply chains love. For D2C parcel shipping, FADR plus on-time rate covers the same ground with less measurement overhead.
How to Track FADR Without Drowning in Spreadsheets
Tracking a blended monthly FADR is better than nothing, but it will not tell you where to act. Structure your tracking in three cuts:
- By courier: Your allocation decisions live here. Rank partners on FADR for comparable lanes.
- By zone or pin code cluster: Metro versus Tier 2 versus Tier 3. This exposes lane-level rot that blended numbers hide.
- By payment mode: COD and prepaid FADR should always be reported separately. Mixing them makes both numbers meaningless.
Review weekly, not monthly. A failing lane discovered on day five costs you a fraction of one discovered on day thirty-five. Moreover, watch trends rather than single data points. One bad week during monsoon flooding is noise. Three declining weeks on the same courier-zone pair is a signal.
Finally, close the loop with your customers. A branded tracking page that shows live status and lets customers reschedule or update instructions does not just cut WISMO tickets. It quietly lifts first attempt success too, because informed customers answer the door.
The Bottom Line: Watch the Metric That Moves First
Let us recap the short version of everything above.
First attempt delivery rate measures the share of parcels delivered on the courier’s first visit. Calculate it as first-attempt deliveries divided by total deliveries, times 100. Aim for 90 percent or better, and treat 95 percent as the mark of a tight operation.
FADR earns its place at the top of your dashboard because it predicts RTO with remarkable accuracy, giving you days of warning before returns hit your P&L. Most failures trace back to fixable causes: absent customers, bad addresses, unverified COD, and underperforming couriers on specific lanes. The fixes are equally concrete: validate addresses, confirm before dispatch, communicate delivery dates, allocate couriers on performance, resolve NDRs within 24 hours, audit fake attempts, and hold partners accountable on a scorecard.
None of this requires a bigger logistics budget. It requires watching the right number and acting on it a week earlier than your competitors do.
Ready to see your FADR by courier, zone, and payment mode in one dashboard? Metaport tracks first attempt performance across all your courier partners and routes every order to the one most likely to deliver it on visit one. Book a demo and find out how many of your RTOs were predictable.
Frequently Asked Questions
Aim for 90 percent or higher as a baseline, with 95 percent and above marking excellent performance. Context matters, though. COD-heavy brands shipping to Tier 2 and Tier 3 pin codes will naturally start lower than prepaid metro-focused brands. Benchmark against your own order mix and compare couriers on identical lanes.
An NDR (non-delivery report) is the notification raised when a single delivery attempt fails, along with the reason, such as customer not available or address issue. RTO (return to origin) is the final outcome after repeated failed attempts, when the courier ships the parcel back to your warehouse. Every RTO starts as one or more NDRs, which is why fast NDR resolution within 24 to 48 hours prevents returns.
Most Indian courier partners make two to three delivery attempts before marking a shipment for RTO. The average parcel takes about 2.3 attempts to deliver, which shows how common first-attempt failure is. Each extra attempt adds cost and lowers the chance of successful delivery, since customer intent fades with every passing day.
COD orders carry no upfront commitment, so customers refuse at the doorstep, run out of cash, or simply lose interest more often. COD shipments fail up to three times more frequently than prepaid ones, and 25 to 30 percent of COD orders end as RTO. Pre-dispatch verification via WhatsApp or IVR and prepaid conversion nudges are the most effective countermeasures.
Start with the two fastest levers. First, add address validation and pin code checks at checkout to remove bad-address failures. Second, switch to performance-based courier allocation so each order routes to the courier with the best first-attempt record for that pin code and payment mode. Together with automated NDR follow-up inside 24 hours, most brands see measurable FADR gains within one billing cycle.

Kapil Pathak is a Senior Digital Marketing Executive with over six years of experience in the logistics and supply chain industry. He specializes in SEO, SEM, and multi-channel campaign management. He has a strong track record of building strategies that boost brand visibility and generate qualified leads. His work focuses on driving growth for D2C and B2B technology companies through data-driven digital marketing initiatives.