Picture this. A customer opens her package, expecting the skincare set she ordered for her sister’s birthday. Instead, she finds a cracked bottle and a stain spreading across the box. She screenshots it, tags your brand on Instagram, and asks for a refund in the same breath.
You issue the refund. You apologize. You move on to the next support ticket.
But here’s the question that matters: do you know which courier handled that order? And do you know if this is the fifth time this month it happened with the same partner?
Most D2C brands can answer that for RTO. Almost none can answer it for damage. Your courier loss and damage rate is one of the most overlooked metrics in Indian ecommerce logistics. It quietly eats into your margins, one broken order at a time.
This article breaks down what the metric actually means. You’ll learn how to calculate it properly, and how to turn that data into smarter courier routing instead of just another line item in your monthly losses.
What Is Courier Loss and Damage Rate, Really?
Your courier loss and damage rate is simply the percentage of shipped orders that arrive lost, missing, or physically damaged, tracked separately for each courier partner you use.
Not returns. Not RTO. Not “customer changed their mind.” Just the orders that never should have left the warehouse in that condition, or never arrived at all.
Here’s why this gets buried. RTO shows up clearly in your courier dashboard as a status. NDR gets its own resolution workflow. But damage? It usually hides inside your support inbox, tagged loosely as “refund requested” or “customer complaint,” with no link back to which courier bag it traveled in.
That disconnect is exactly why most brands never build a real damage rate by courier. They know it’s happening. They just cannot say how much, or with whom.
Why This Number Quietly Bleeds Your Margins
It’s tempting to treat a handful of damaged parcels as a rounding error. It isn’t, and the numbers back that up.
Industry data compiled by Opensend points to roughly 3 to 4 percent of all shipped packages arriving damaged. Over 85 million damaged packages were recorded globally in 2024 alone, a 30 percent jump from the year before. Even at the low end, that is not a rounding error for a brand shipping thousands of orders a month.
The cost doesn’t stop at the replacement product. Think about everything stacked on top of it:
- The original product cost, gone
- Reverse or forward shipping to make it right
- Support team hours spent calming an upset customer
- A support ticket that would not have existed with a better courier
And the relationship damage lingers longer than the refund. A recent Narvar post-purchase report found that 86 percent of shoppers hit at least one delivery problem last year. Worse, 60 percent of shoppers aged 18 to 29 said they will not return to a brand after a single bad delivery experience. A damaged unboxing moment does not just cost you one order. It quietly costs you the next five.
If you have already mapped your true shipping cost per order, a hidden damage rate is one of the biggest reasons that number never quite adds up. It behaves a lot like the hidden shipping surcharges that quietly inflate your logistics bill without ever showing up on the invoice.
How to Actually Calculate Your Courier Loss and Damage Rate
Here’s the good news. The formula itself is simple.
Courier loss and damage rate = (Orders lost or damaged in transit ÷ Total orders shipped with that courier) × 100
Calculate it separately for every courier you use, every month. A blended number across all your couriers tells you almost nothing useful, and we’ll get to why in a moment.
To pull this together, you’ll need three data sources talking to each other:
- Support ticket tags. Every ticket about a missing or damaged order should be tagged with the courier’s name and the AWB number, not just “refund issued.”
- NDR and delivery remarks. Couriers often log “item missing” or “package tampered” directly in their delivery attempt notes. Most brands never read past the RTO status to see this.
- Claim filings. If you’re filing claims for lost or damaged parcels, that log is a ready-made damage register. Tie it back to courier and route.
As a rough benchmark, a healthy damage rate usually sits under 1 to 2 percent per courier. Anything consistently above that deserves a closer look, especially if one courier’s number is climbing while others stay flat.
Why One Blended Average Hides the Real Problem
Here’s where most brands go wrong. They calculate one overall damage rate for the whole business and call it done.
Say your combined damage rate looks like a tolerable 2.1 percent. Sounds manageable, right? But break it down by courier, and the picture often looks very different: Courier A sits at a clean 0.8 percent, Courier B is around 1.5 percent, and Courier C is quietly running at 6 percent on a specific route.
That blended number just hid a courier that is six times worse than your best partner. If Courier C also happens to be carrying a big share of your volume on a particular zone, you’re bleeding money and you don’t even know where to look.
This is exactly why multi-carrier shipping only pays off when you actually track performance per carrier instead of treating every courier as interchangeable. Damage rate deserves the same courier-by-courier discipline you’d already apply to RTO or delivery speed on a courier performance scorecard.
From Tracking to Routing: Turning Data Into Action
Measuring damage rate is only half the job. The real value shows up when that data starts changing where your next order gets routed.
Build a courier-wise damage scorecard
Add loss and damage rate as its own column next to RTO, NDR, and on-time delivery. Review it monthly, by courier and, where volume allows, by zone. A courier that looks fine nationally can still be quietly terrible in one region.
Set a threshold and flag breaches automatically
Decide what “too high” looks like for your business, say 2 percent, and flag any courier that crosses it two months running. This turns damage rate from a metric you glance at into one that actually triggers a decision.
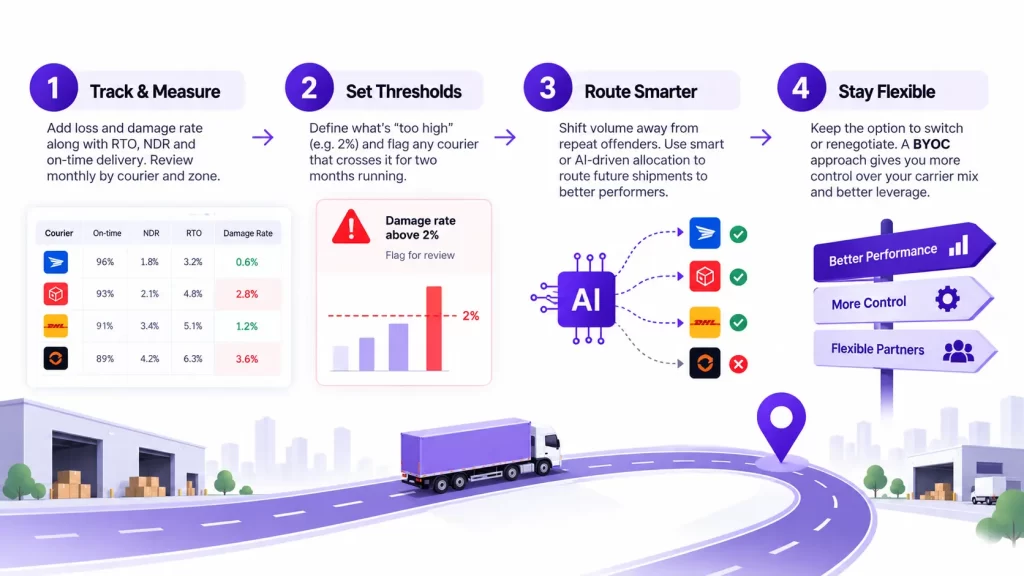
Shift volume away from repeat offenders
This is where smart courier allocation earns its keep. Instead of manually reassigning couriers order by order, route future shipments toward your better performers automatically, especially for fragile or high-value categories. Pair this with AI-driven courier allocation so the system adjusts as courier performance shifts, rather than waiting for your next monthly review.
Keep the option to switch or renegotiate
Brands that rely on a single locked-in courier rarely have leverage here. If you’ve been weighing more control over your carrier mix, this is a clear argument for the BYOC route instead of staying boxed into one aggregator’s default choices.
Packaging Helps, But It Is Not the Whole Story
Right-sized boxes, proper cushioning, and fragile labeling genuinely reduce damage, and if you’re shipping breakable items, they’re worth doing well. Fill empty space, use sturdy mailers for anything glass or ceramic, and mark fragile shipments clearly.
But here’s the honest part nobody likes to admit: even perfectly packed orders get damaged when a courier’s sorting hub is rough on parcels or a delivery agent tosses your box into a stack of ten others. Packaging fixes the controllable half of the problem. Courier accountability fixes the other half, and that’s the half most brands never touch.
When a Parcel Does Arrive Lost or Damaged
Briefly, in case it happens tomorrow: most Indian couriers cap their liability to the value you declared at booking, and claims usually need to be filed within a short window, often just a few days. Keep photos, the original invoice, and packaging evidence handy before you contact support, since a vague complaint rarely gets resolved in your favor.
That said, filing claims one at a time is a losing game if the same courier keeps causing them. Fixing the routing upstream matters more than getting good at filing paperwork downstream.
Common Mistakes That Skew Your Damage Data
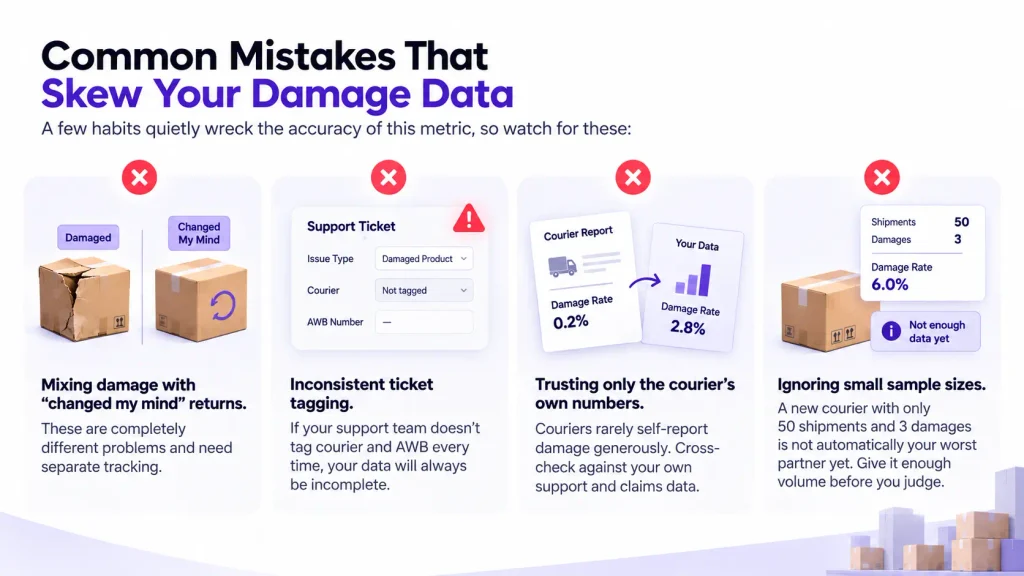
A few habits quietly wreck the accuracy of this metric, so watch for these:
- Mixing damage with “changed my mind” returns. These are completely different problems and need separate tracking.
- Inconsistent ticket tagging. If your support team doesn’t tag courier and AWB every time, your data will always be incomplete.
- Trusting only the courier’s own numbers. Couriers rarely self-report damage generously. Cross-check against your own support and claims data.
- Ignoring small sample sizes. A new courier with only 50 shipments and 3 damages is not automatically your worst partner yet. Give it enough volume before you judge.
Wrapping It Up
Your courier loss and damage rate will not fix itself just because you started tracking it. But you cannot fix what you refuse to measure. Right now, most D2C brands are flying blind on this exact number, and it is eating a slow, steady hole in their margins.
Start small. Tag your support tickets properly this month. Pull a damage rate per courier. You’ll likely be surprised by which partner is quietly your worst offender.
Ready to see your courier loss and damage rate broken down automatically, courier by courier, zone by zone? Book a demo with Metaport and turn that blind spot into your next competitive edge.
Frequently Asked Questions
Most healthy courier partners should sit under 1 to 2 percent for combined loss and damage on a monthly basis. Anything consistently higher, especially on a specific route or zone, is worth investigating before it becomes a pattern.
RTO (Return to Origin) means an order was never delivered and came back to you, often due to address issues or customer refusal. Loss and damage rate specifically covers parcels that went missing entirely or arrived physically damaged, a distinct and often under-tracked problem.
Liability is typically capped at the value you declared when booking the shipment, not the actual product value. Most couriers also require claims to be filed within a short window, so keeping proof of value and packaging condition matters from day one.
Monthly is a reasonable baseline for most D2C brands, though high-volume sellers benefit from reviewing weekly, especially during festive or sale periods when parcel volumes and handling risk both spike.
Yes, but only if you track performance separately per courier and route volume based on that data. Simply adding more couriers without measuring their individual loss and damage rate just spreads the same blind spot across more partners.

Kapil Pathak is a Senior Digital Marketing Executive with over six years of experience in the logistics and supply chain industry. He specializes in SEO, SEM, and multi-channel campaign management. He has a strong track record of building strategies that boost brand visibility and generate qualified leads. His work focuses on driving growth for D2C and B2B technology companies through data-driven digital marketing initiatives.